
Source: Shutterstock
Highlights
- Rambus’ net income surged 83.3% YoY to USD 60.3 million in Q1FY25, reflecting revenue growth despite higher costs
- Cash and cash equivalents increased 32.5% YoY to USD 132.2 million
- In March, Rambus launched its next-gen Crypto Manager Security IP suite with scalable security solutions
- For Q2FY25, Rambus projects product revenue between USD 77–83 million and royalty revenue of USD 67–73 million
Rambus Inc. (NASDAQ:RMBS) is a leading provider of chips, silicon intellectual property (IP), and technology solutions designed to tackle the core challenges of accelerating data processing and boosting performance in data centers and other high-growth markets.
In the first quarter of the financial year 2025 (Q1FY25), Rambus reported total revenue of USD 166.7 million, representing a 41.4% increase compared to Q1 FY24, primarily driven by higher contributions from both its product and royalty segments.
Net income rose to USD 60.3 million in 1FY25, up 83.3% YoY, as increased revenue was partially offset by higher total costs of revenue. Cash inflow from operating activities reached USD 230.6 million, a 17.8% YoY increase, supported by improved net income, though partially offset by an unfavourable change in net working capital.
As of the end of the quarter, cash and cash equivalents stood at USD 132.2 million, up 32.5% from the prior year, due to inflows from operations, partially offset by outflows from investing and financing activities.
Recent Business Update
In March, Rambus unveiled its next-generation CryptoManager Security IP solutions, featuring the updated Root of Trust, Hub, and Core product families. These offerings provide scalable levels of security and functional integration, allowing customers to select the security features and capabilities that best align with their specific needs.
Company Outlook
Rambus Inc. expects Q2 2025 licensing billings of USD 64–70 million, royalty revenue of USD 67–73 million, product revenue of USD 77–83 million, and contract and other revenue of USD 17–23 million, subject to customer agreements. GAAP operating expenses are projected at USD 106–110 million, while non-GAAP expenses are estimated at USD 90–94 million, excluding USD 14 million in stock-based compensation and USD 2 million in amortization. Projections assume a 20% tax rate and 109 million diluted shares.
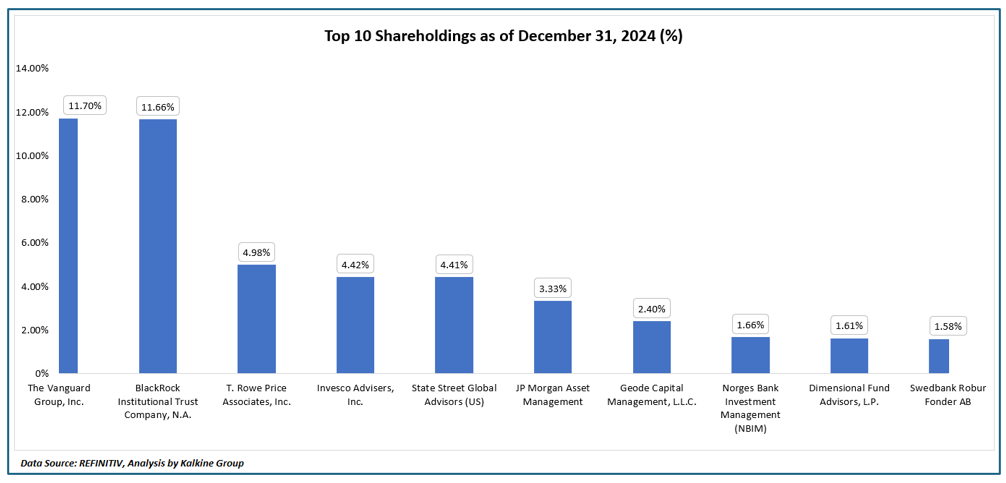
Top 10 Shareholders
Ownership is relatively concentrated, with the top 10 shareholders controlling approximately 47.75% of outstanding shares. The Vanguard Group, Inc. and BlackRock Institutional Trust Company, N.A. are the largest stakeholders, holding about 11.70% and 11.66%, respectively.
Stock Information
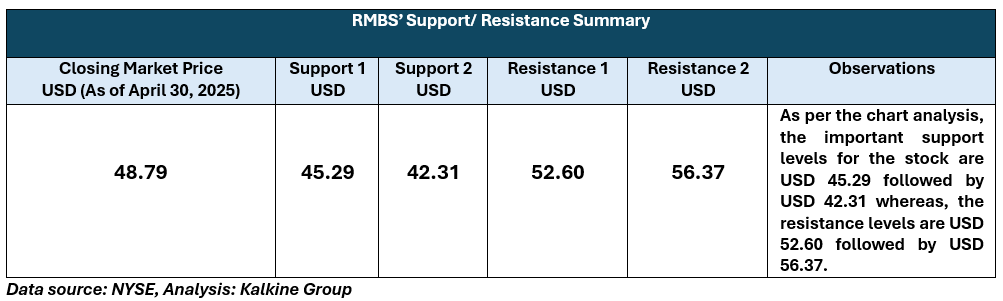
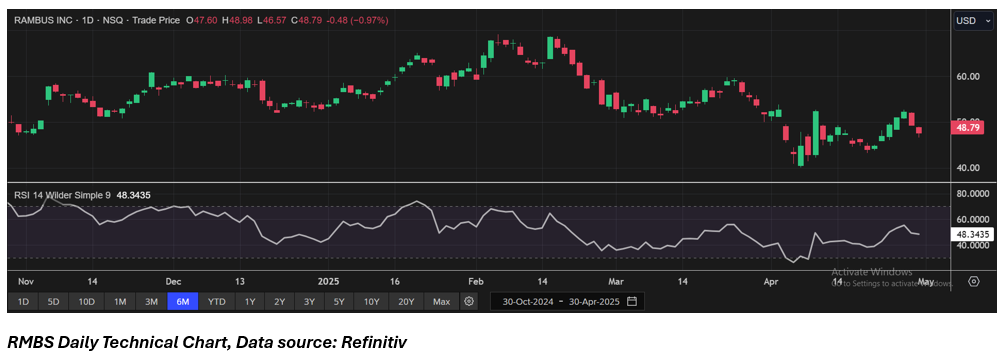
Over the past three months, RMBS shares have declined by 17.70%, with a year-to-date drop of 7.69%. The stock is currently trading near the lower end of its 52-week range, between a high of USD69.15 and a low of USD37.42. As of April 30, 2025, the stock’s closing price is USD48.79.
Note 1: Past performance is not a reliable indicator of future performance.
Note 2: The reference data for all price data, currency, technical indicators, support, and resistance levels is April 30 2025. The reference data in this report has been partly sourced from REFINITIV.
Technical Indicators Defined
Support: A level at which the stock prices tend to find support if they are falling, and a downtrend may take a pause backed by demand or buying interest. Support 1 refers to the nearby support level for the stock and if the price breaches the level, then Support 2 may act as the crucial support level for the stock.
Resistance: A level at which the stock prices tend to find resistance when they are rising, and an uptrend may take a pause due to profit booking or selling interest. Resistance 1 refers to the nearby resistance level for the stock and if the price surpasses the level, then Resistance 2 may act as the crucial resistance level for the stock.
Disclaimer:
StockNextt having Ontario Business Identification Number 1000958347 and British Columbia registration Number FM1051529 is a trade name under Kalkine Canada Advisory Services Inc., having Business Number 761925130BC0001. The information provided on https://stocknextt.com “Website” is general information only and it does not consider your investment objectives, financial situation and the particular needs of any particular person. You should therefore consider whether the advice is appropriate to your investment objectives, financial situation and needs before acting upon it. You should seek advice from a financial adviser, stockbroker or other professional (including taxation and legal advice) as necessary before acting on any advice. Not all investments are appropriate for all people. The Website is published by StockNextt a trade name under Kalkine Canada Advisory Services Inc. The link to our Terms and Conditions and Privacy Policy has been provided for your reference. On the date of publishing this article/report (mentioned on the website), employees and/or associates of StockNextt or Kalkine do not hold positions in any of the stocks covered on the website. These stocks can change any time and readers of the articles/ reports should not consider these stocks as advice or recommendations later.