
Source: © 2025 Krish Capital Pty. Ltd.
Highlights
Microchip Technology Incorporated (NASDAQ:MCHP) delivers smart, connected, and secure embedded control solutions. Through its semiconductor products segment, the company designs, develops, manufactures, and markets mixed-signal microcontrollers, development tools, and a broad range of analog, interface, timing, wired and wireless connectivity, mixed-signal, and memory products.
The company’s recent operating metrics for the second quarter of the financial year 2026 (Q2 FY2026) reported revenue of USD 1,140.4 million compared with USD 1,163.8 million in Q2 FY2025, a decline of 2% year over year. Comprehensive loss attributable to common stockholders narrowed to USD 41.7 million from USD 78.4 million, a reduction of 46.8%, while year-to-date cash from operating activities decreased to USD 363.7 million from USD 420.7 million. Total cash, cash equivalents, and marketable securities stood at USD 236.8 million versus USD 771.7 million a year earlier, reflecting a 69.3% decline.
Moreover, Microchip pointed to signs of improving demand, including 10% sequential growth in bookings and a book-to-bill ratio of 1.06, which it associated with ongoing inventory normalization and firmer order flow. The company also noted that Q2 FY2026 revenue increased 6% quarter-on-quarter to USD 1.14.
Recent Business Update
The company’s January 5, 2026, Q3 FY26 business update outlined expectations for net sales of about USD 1.185 billion, with management highlighting improved bookings, inventory reduction, and progress on its recovery strategy. A prior release on December 2, 2025, reported that sales and earnings per share for the third quarter of fiscal 2026 were expected near the high end of earlier guidance, supported by stronger backlog and sustained booking activity.
Outlook
For Q3 FY2026, The company described its outlook as gradually improving as inventory normalization advances and customer demand recovers. Management guided net sales for the quarter to a range of USD 1.109–1.149 billion, citing sequential booking growth, a book-to-bill ratio above one, and increased requests for expedited shipments. The company also reiterated a focus on cost control, limited capital expenditures of about USD 100 million for FY2026, and selective investment in capacity and research and development.
Share Performance
MCHP posted a 10.49% gain over three months, while the six-month return slipped 0.99%. The stock traded between a 52-week high of 77.20 and a 52-week low of 34.13 during the period.
Note 1: Past performance is not a reliable indicator of future performance.
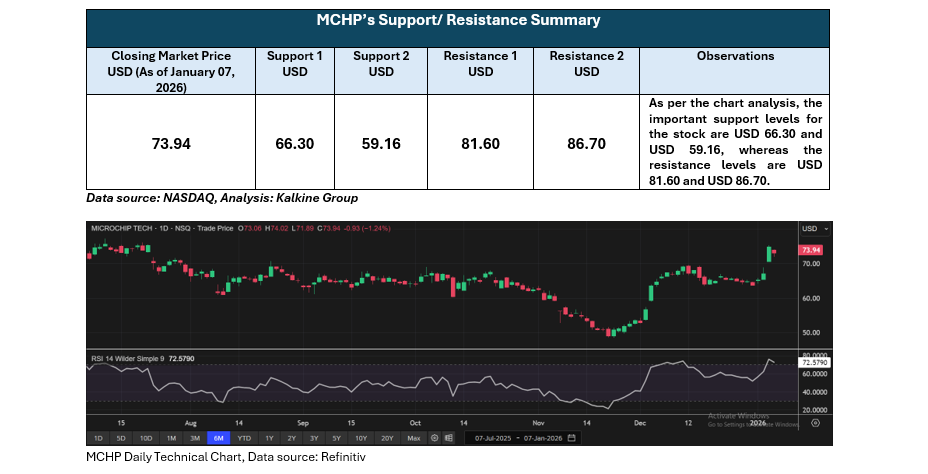
Note 2: The reference date for all price data, currency, technical indicators, support, and resistance levels is January 07, 2026. The reference data in this report has been partly sourced from REFINITIV.
Technical Indicators Defined: -
Support: A level at which the stock prices tend to find support if they are falling, and a downtrend may take a pause backed by demand or buying interest. Support 1 refers to the nearby support level for the stock and if the price breaches the level, then Support 2 may act as the crucial support level for the stock.
Resistance: A level at which the stock prices tend to find resistance when they are rising, and an uptrend may take a pause due to profit booking or selling interest. Resistance 1 refers to the nearby resistance level for the stock and if the price surpasses the level, then Resistance 2 may act as the crucial resistance level for the stock.
Disclaimer:
StockNextt having Ontario Business Identification Number 1000958347 and British Columbia registration Number FM1051529 is a trade name under Kalkine Canada Advisory Services Inc., having Business Number 761925130BC0001. The information provided on https://stocknextt.com “Website” is general information only and it does not consider your investment objectives, financial situation and the particular needs of any particular person. You should therefore consider whether the advice is appropriate to your investment objectives, financial situation and needs before acting upon it. You should seek advice from a financial adviser, stockbroker or other professional (including taxation and legal advice) as necessary before acting on any advice. Not all investments are appropriate for all people. The Website is published by StockNextt a trade name under Kalkine Canada Advisory Services Inc. The link to our Terms and Conditions and Privacy Policy has been provided for your reference. On the date of publishing this article/report (mentioned on the website), employees and/or associates of StockNextt or Kalkine do not hold positions in any of the stocks covered on the website. These stocks can change any time and readers of the articles/ reports should not consider these stocks as advice or recommendations later.