Recommendation: Buy
| Entry Date | Symbol | Recommendation | Entry Price (USD) | Target 1 (USD) | Target 2 (USD) | Holding Duration | Position Status | Return(%)* |
|---|---|---|---|---|---|---|---|---|
| 17 Mar, 26 | PLTR | Buy | USD 156.27 | USD 164.0 | USD 175.0 | 13 days | Closed |
 10.41%
|
*Return(%) represent the percentage change between the entry price and exit price of the recommendation.
Data Powered by EOD Historical Data (“EODHD”).
Palantir Technologies Inc. builds and deploys software platforms for the intelligence community in the United States to assist in counterterrorism investigations and operations. The company provides Palantir Gotham, a software platform which enables users to identify patterns hidden deep within datasets, ranging from signals intelligence sources to reports from confidential informants, as well as facilitates the handoff between analysts and operational users, helping operators plan and execute real-world responses to threats that have been identified within the platform. It also offers Palantir Foundry, a platform that transforms the ways organizations operate by creating a central operating system for their data; and allows individual users to integrate and analyze the data they need in one place. In addition, it provides Palantir Apollo, a software that enables customers to deploy their own software virtually in any environment. Palantir Technologies Inc. was incorporated in 2003 and is based in Denver, Colorado.

Enhanced Profitability: Net Margin of 36.5% in FY25 vs Industry Median of 4.0%
Strong Revenue Growth Momentum: Total revenue of USD 4475.4 million in FY25 vs USD 2865.5 million in FY24

Elevated Operating Expense: Total Operating Expense of USD 3061.4 million in FY25 vs USD 2555.1 million in FY24
Higher Cash Cycle: Cash Cycle of 64.2 Days in FY25 vs 56.1 Days in FY24
Palantir’s future performance remains exposed to concentration in large government contracts, long and uncertain sales cycles, and execution risks associated with scaling its AI-driven commercial business amid increasing competition and evolving regulatory frameworks
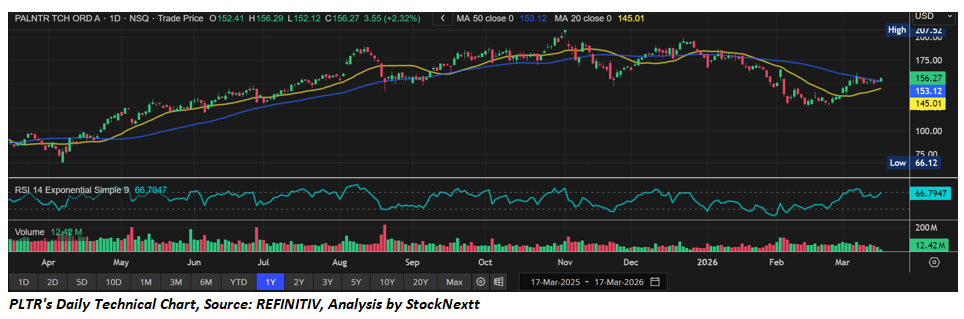
| Entry Price | Support* | Target 1** | Target 2** |
|---|---|---|---|
| 156.27 | 140.0 | 164.0 | 175.0 |
Data Source: REFINITIV, Analysis: StockNextt
*Support can be considered as an indicative stop-loss, and if prices move below that level on closing basis individuals may evaluate exiting the position depending on their risk appetite, previous holdings, and other factors considered. The support and resistance levels may need to be re-evaluated within 4-6 weeks’ time frame depending on the stock price movements from the date of recommendation on the stock.
**Target prices may vary by ±0.5% depending on market volatility.
Revenue Expansion Driven by AI and Commercial Momentum: Palantir reported strong revenue growth in FY25, with total revenue reaching USD 4.48 billion (FY25) compared to USD ~2.87 billion (FY24), reflecting a +56% year-on-year increase. This growth was primarily driven by accelerated adoption of its Artificial Intelligence Platform (AIP) and increasing traction in commercial markets, particularly in the United States. The company continues to benefit from rising enterprise demand for integrated data and AI-driven decision platforms.
Segment Performance: Commercial Outperformance vs Government Stability: The commercial segment emerged as the primary growth engine, with U.S. commercial revenue rising +109% YoY to USD 1.47 billion (FY25) . In contrast, government revenue remained robust but relatively stable, with U.S. government revenue increasing +55% YoY to USD 1.85 billion (FY25). The revenue mix reflects Palantir’s gradual transition from a government-heavy model toward a more balanced commercial-driven growth trajectory.
Profitability and Operating Leverage Expansion: Palantir demonstrated significant operating leverage in FY25, with adjusted operating income reaching USD 2.25 billion and a margin of 50%, compared to materially lower levels in FY24. The expansion was driven by improved cost discipline, scaling efficiencies, and higher contribution margins from existing customers. This indicates a shift toward sustained profitability following years of heavy investment.
Cash Flow Strength and Balance Sheet Positioning: The company generated adjusted free cash flow of USD 2.27 billion in FY25 (51% margin), underscoring strong cash conversion capabilities. Additionally, Palantir ended FY25 with a robust liquidity position of USD 7.2 billion in cash, cash equivalents, and short-term securities, providing flexibility for strategic investments, partnerships, and expansion initiatives.
Contract Value Growth and Customer Expansion: Palantir’s total contract value (TCV) surged to USD 10.8 billion in FY25, up +128% YoY, reflecting strong deal momentum and pipeline visibility. The company also expanded its customer base to 954 customers as of December 31, 2025, indicating continued penetration across both commercial enterprises and government institutions. Growth in average revenue per top customer further highlights deepening enterprise relationships.
Product Innovation and AI Platform (AIP) Adoption: FY25 marked a pivotal year for Palantir’s AIP platform, which integrates large language models (LLMs) into enterprise workflows. AIP has become a key differentiator, enabling faster deployment cycles and higher-value use cases across industries. The company’s core platforms—Gotham, Foundry, Apollo, and AIP—continue to provide a vertically integrated ecosystem, enhancing customer stickiness and long-term contract scalability.
Strategic Positioning and Market Expansion: Palantir strengthened its positioning through partnerships (e.g., Accenture collaboration) and sector-specific solutions, including defense and industrial applications. The company continues to target large-scale, complex deployments with high barriers to entry, leveraging its embedded deployment model and long sales cycles to establish durable competitive advantages.
Considering recent key business, financial updates, current trading levels, and key business risks, a ‘Buy’ recommendation has been given to Palantir Technologies Inc. (NASDAQ: PLTR) at the current market price of USD 156.27, as on Mar 17, 2026 at 8:07 am PDT
Data Powered by EOD Historical Data (“EODHD”).
Sector: Technology Industry: Software - Infrastructure
| Company | Change (USD) | Price (USD) | Trailing PE (x) | Forward PE (x) | Price Sales TTM (x) | Price to Book Value (x) | Enterprise Value to Revenue (x) | Enterprise Value to EBITDA (x) |
|---|---|---|---|---|---|---|---|---|
| PLTR Palantir Technologies Inc. |
-2.16 1.65% | 128.47 | 248.71 | 58.48 | 18.02 | 11.77 | 16.23 | 167.02 |
| MSFT Microsoft Corporation |
0.49 0.13% | 379.40 | 37.32 | 29.94 | 13.03 | 12.45 | 13.06 | 24.59 |
| ORCL Oracle Corporation |
0.76 0.41% | 184.29 | 29.34 | 18.66 | 5.55 | 74.06 | 7.10 | 18.13 |
| CRWD Crowdstrike Holdings Inc |
1.90 0.28% | 684.86 | - | 89.29 | 23.70 | 24.81 | 21.91 | 577.82 |
| PANW Palo Alto Networks Inc |
5.65 2.00% | 287.78 | 44.57 | 45.05 | 11.98 | 20.70 | 11.82 | 77.11 |
Data Powered by EOD Historical Data (“EODHD”).
Markets are trading in a highly volatile zone currently due to certain macro-economic issues and prevailing geopolitical tensions. Therefore, it is prudent to follow a cautious approach while investing.
Related Risks: This report may be looked at from high-risk perspective and recommendations are provided are for a short duration. Recommendations provided in this report are solely based on technical parameters, and the fundamental performance of the stocks has not been considered in the decision-making process. Other factors which could impact the stock prices include market risks, regulatory risks, interest rates risks, currency risks, social and political instability risks etc.
Note 1: Past performance is not a reliable indicator of future performance.
Note 2: The reference date for all price data, currency, technical indicators, support, and resistance levels as on March 17, 2026. The reference data in this report has been partly sourced from REFINITIV.
Note 3: Investment decisions should be made depending on an individual's appetite for upside potential, risks, holding duration, and any previous holdings. An 'Exit' from the stock can be considered if the Target Price mentioned has been achieved and is subject to the factors discussed above.
Note 4: StockNextt reports are prepared based on the stock prices captured either from REFINITIV or Trading View. Typically, REFINITIV or Trading View may reflect stock prices with a delay which could be a lag of 15-20 minutes. There can be no assurance that future results or events will be consistent with the information provided in the report. The information is subject to change without any prior notice.
Support: A level at which the stock prices tend to find support if they are falling, and a downtrend may take a pause backed by demand or buying interest. Support 1 refers to the nearby support level for the stock and if the price breaches the level, then Support 2 may act as the crucial support level for the stock.
Target: A level at which the stock prices tend to find resistance when they are rising, and an uptrend may take a pause due to profit booking or selling interest. Target 1 refers to the nearby resistance level for the stock and if the price surpasses the level, then Target 2 may act as the crucial resistance level for the stock.
Stop-loss: It is a level to protect further losses in case of unfavourable movement in the stock prices.
Disclaimer :
This report has been issued by StockNextt which has an Ontario Business Identification Number 1000958347 and British Columbia registration Number FM1051529 is a trade name under Kalkine Canada Advisory Services Inc. having Business Number 761925130BC0001. Kalkine Canada Advisory Services Inc. and StockNextt are collectively referred to as “StockNextt”, “we”, “us”, and “our”. The website https://stocknextt.com and associated pages are published by StockNextt. The information in this report and on the StockNextt website has been prepared from a wide variety of sources, which StockNextt, to the best of its knowledge and belief, considers accurate. StcokNextt has made every effort to ensure the reliability of information contained in its reports, newsletters, and websites. All information represents our views at the date of publication and may change without notice. The information in this report does not constitute an offer to sell securities or other financial products or a solicitation of an offer to buy securities or other financial products. Our reports contain general recommendations for investing in securities and other financial products. StockNextt does not offer financial advice based upon your personal financial situation or goals, and we shall not be held liable for any investment or trading losses you may incur by using the opinions expressed in our reports, publications, market updates, news alerts and corporate profiles. StockNextt does not intend to exclude any liability which it is not permitted to exclude under applicable law or regulation. StockNextt’s general advice does not in any way endorse or recommend individuals, investment products or services for your personal financial situation. You should discuss your portfolios and the risk tolerance level appropriate for your personal financial situation, with a professional authorised financial planner and adviser. You should be aware that the value of any investment and the income from it can go down as well as up and you may not get back the amount invested. Please also read our Terms and conditions for further information. Employees and/or associates of StockNextt and its related entities may hold an interest in the securities or other financial products covered in this report or on the StockNextt website. Any such employees and associates are required to comply with certain safeguards, procedures and disclosures as required by law.
Copyright © 2026 Krish Capital Pty Ltd. All rights reserved. No part of this website, or its content, may be reproduced in any form without our prior consent.