Recommendation: Speculative Buy
| Entry Date | Symbol | Recommendation | Entry Price (CAD) | Target 1 (CAD) | Target 2 (CAD) | Holding Duration | Position Status | Return(%)* |
|---|---|---|---|---|---|---|---|---|
| 30 Oct, 24 | KMP-UN | Speculative Buy | CAD 19.22 | CAD 21.526 | CAD 23.033 | Same day | Closed |
 13.58%
|
*Return(%) represent the percentage change between the entry price and exit price of the recommendation.
Data Powered by EOD Historical Data (“EODHD”).
Killam Apartment REIT, based in Halifax, Nova Scotia, is one of Canada's largest residential real estate investment trusts, owning, operating, managing and developing a $4.9 billion portfolio of apartments and manufactured home communities. Killam's strategy to enhance value and profitability focuses on three priorities: 1) increasing earnings from existing operations; 2) expanding the portfolio and diversifying geographically through accretive acquisitions, with an emphasis on newer properties; and 3) developing high-quality properties in its core markets.

Higher Property Revenue: CAD 90.7 mn in Q2 2024 vs CAD 86.8 mn in Q2 2023
Higher Net Operating Income: CAD 59.9 mn in Q2 2024 vs CAD 56.2 mn in Q2 2023

Higher Finance Cost: CAD 19.4 mn in Q2 2024 vs CAD 16.2 mn in Q2 2023
Higher Construction Loans: CAD 42.0 mn in Q2 2024 vs CAD 29.6 mn in Q4 2023
Mortgage and interest rates, Government regulations, Lease rates, Lower occupancy ratio, Inflation, etc.
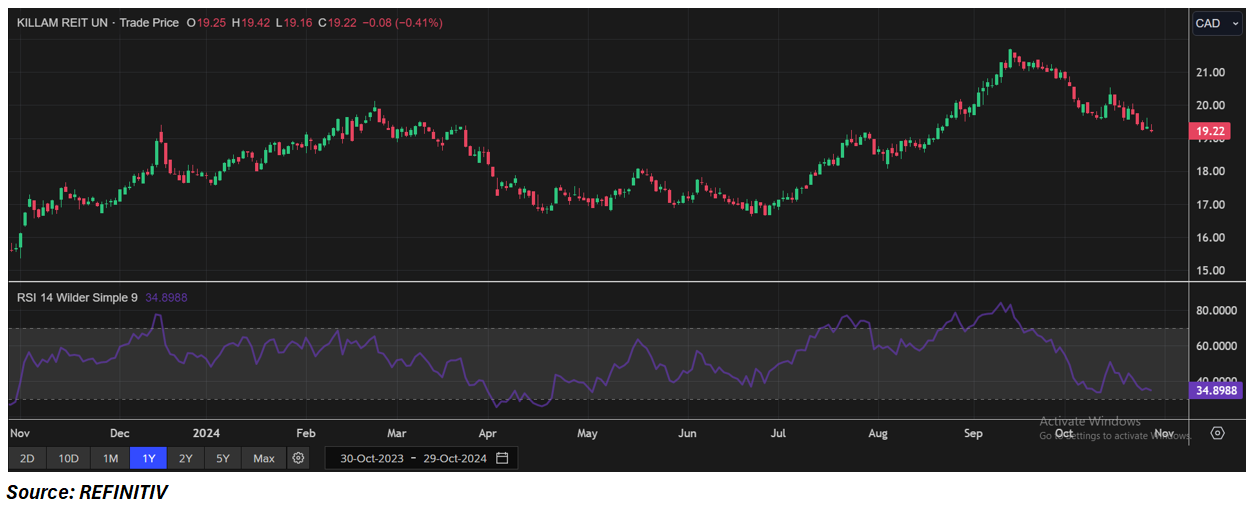
| Entry Price | Support* | Target 1** | Target 2** |
|---|---|---|---|
| 19.22 | 16.7 | 21.526 | 23.033 |
Data Source: REFINITIV, Analysis: StockNextt
*Support can be considered as an indicative stop-loss, and if prices move below that level on closing basis individuals may evaluate exiting the position depending on their risk appetite, previous holdings, and other factors considered. The support and resistance levels may need to be re-evaluated within 4-6 weeks’ time frame depending on the stock price movements from the date of recommendation on the stock.
**Target prices may vary by ±0.5% depending on market volatility.
Growing Same Property NOI: In Q2-2024, the company experienced 8.5% rise in property NOI and a 140 basis point increase in operating profit. This gain was fueled by a 6.1% increase in same-property income. The same property revenue rise is ascribed to a 6.4% increase in apartment rental rates year on year, a 39% reduction in rental incentives, increased ancillary revenue, and steady occupancy.
Healthy cash flows: In Q2 2024, the company's cash from operating activities climbed to CAD 36.3 million from CAD 27.1 million in pcp. The increase is due to sturdy NOI growth from the same property portfolio, slightly offset by increased interest costs and decreased capitalized interest. Additionally, three additional developments that are now in the lease-up phase are expected to contribute positively to profits growth in the second half of 2024 and the first half of 2025.
Positive outlook: The company's forecast for the remainder of the year is optimistic. With a housing shortage throughout Canada, apartment fundamentals are expected to continue robust for the foreseeable future. Following a two-year increase in market rental rates, the company's mark-to-market gap now averages over 25% throughout its portfolio. Management hopes to capture some of these spreads as units turn.
Data Powered by EOD Historical Data (“EODHD”).
Sector: Real Estate Industry: REIT - Residential
| Company | Change (CAD) | Price (CAD) | Trailing PE (x) | Forward PE (x) | Price Sales TTM (x) | Price to Book Value (x) | Enterprise Value to Revenue (x) | Enterprise Value to EBITDA (x) |
|---|---|---|---|---|---|---|---|---|
| KMP-UN Killam Apartment Real Estate Investment Trust |
-0.34 1.79% | 18.67 | 8.59 | 15.24 | 6.32 | 0.88 | 12.62 | 12.24 |
| CAR-UN Canadian Apartment Properties Real Estate Investment Trust |
-0.15 0.43% | 34.79 | - | 17.83 | 7.60 | 0.85 | 14.21 | -114.1787 |
| BEI-UN Boardwalk Real Estate Investment Trust |
-0.35 0.53% | 65.21 | 6.35 | 18.28 | 7.15 | 0.95 | 13.19 | 11.47 |
| HOM-UN BSR Real Estate Investment Trust |
-0.44 2.69% | 15.92 | - | 12.36 | 5.33 | 0.50 | 9.54 | -13.2333 |
| MRG-UN Morguard North American Residential Real Estate Investment Trust |
0.01 0.06% | 16.85 | - | 25.32 | 2.55 | 0.30 | 6.58 | 55.94 |
Data Powered by EOD Historical Data (“EODHD”).
Markets are trading in a highly volatile zone currently due to certain macro-economic issues and prevailing geopolitical tensions. Therefore, it is prudent to follow a cautious approach while investing.
Related Risks: This report may be looked at from high-risk perspective and recommendations are provided are for a short duration. Recommendations provided in this report are solely based on technical parameters, and the fundamental performance of the stocks has not been considered in the decision-making process. Other factors which could impact the stock prices include market risks, regulatory risks, interest rates risks, currency risks, social and political instability risks etc.
Note 1: Past performance is not a reliable indicator of future performance.
Note 2: The reference date for all price data, currency, technical indicators, support, and resistance levels as on October 30, 2024. The reference data in this report has been partly sourced from REFINITIV.
Note 3: Investment decisions should be made depending on an individual's appetite for upside potential, risks, holding duration, and any previous holdings. An 'Exit' from the stock can be considered if the Target Price mentioned has been achieved and is subject to the factors discussed above.
Note 4: StockNextt reports are prepared based on the stock prices captured either from REFINITIV or Trading View. Typically, REFINITIV or Trading View may reflect stock prices with a delay which could be a lag of 15-20 minutes. There can be no assurance that future results or events will be consistent with the information provided in the report. The information is subject to change without any prior notice.
Support: A level at which the stock prices tend to find support if they are falling, and a downtrend may take a pause backed by demand or buying interest. Support 1 refers to the nearby support level for the stock and if the price breaches the level, then Support 2 may act as the crucial support level for the stock.
Target: A level at which the stock prices tend to find resistance when they are rising, and an uptrend may take a pause due to profit booking or selling interest. Target 1 refers to the nearby resistance level for the stock and if the price surpasses the level, then Target 2 may act as the crucial resistance level for the stock.
Stop-loss: It is a level to protect further losses in case of unfavourable movement in the stock prices.
Disclaimer :
This report has been issued by StockNextt which has an Ontario Business Identification Number 1000958347 and British Columbia registration Number FM1051529 is a trade name under Kalkine Canada Advisory Services Inc. having Business Number 761925130BC0001. Kalkine Canada Advisory Services Inc. and StockNextt are collectively referred to as “StockNextt”, “we”, “us”, and “our”. The website https://stocknextt.com and associated pages are published by StockNextt. The information in this report and on the StockNextt website has been prepared from a wide variety of sources, which StockNextt, to the best of its knowledge and belief, considers accurate. StcokNextt has made every effort to ensure the reliability of information contained in its reports, newsletters, and websites. All information represents our views at the date of publication and may change without notice. The information in this report does not constitute an offer to sell securities or other financial products or a solicitation of an offer to buy securities or other financial products. Our reports contain general recommendations for investing in securities and other financial products. StockNextt does not offer financial advice based upon your personal financial situation or goals, and we shall not be held liable for any investment or trading losses you may incur by using the opinions expressed in our reports, publications, market updates, news alerts and corporate profiles. StockNextt does not intend to exclude any liability which it is not permitted to exclude under applicable law or regulation. StockNextt’s general advice does not in any way endorse or recommend individuals, investment products or services for your personal financial situation. You should discuss your portfolios and the risk tolerance level appropriate for your personal financial situation, with a professional authorised financial planner and adviser. You should be aware that the value of any investment and the income from it can go down as well as up and you may not get back the amount invested. Please also read our Terms and conditions for further information. Employees and/or associates of StockNextt and its related entities may hold an interest in the securities or other financial products covered in this report or on the StockNextt website. Any such employees and associates are required to comply with certain safeguards, procedures and disclosures as required by law.
Copyright © 2026 Krish Capital Pty Ltd. All rights reserved. No part of this website, or its content, may be reproduced in any form without our prior consent.