Recommendation: Buy
| Entry Date | Symbol | Recommendation | Entry Price (USD) | Target 1 (USD) | Target 2 (USD) | Holding Duration | Position Status | Return(%)* |
|---|---|---|---|---|---|---|---|---|
| 18 Nov, 24 | IBM | Buy | USD 204.99 | USD 223.44 | USD 239.84 | 4 days | Closed |
 10.83%
|
*Return(%) represent the percentage change between the entry price and exit price of the recommendation.
Data Powered by EOD Historical Data (“EODHD”).
International Business Machines Corporation, together with its subsidiaries, provides integrated solutions and services worldwide. The company operates through Software, Consulting, Infrastructure, and Financing segments. The Software segment offers a hybrid cloud and AI platforms that allows clients to realize their digital and AI transformations across the applications, data, and environments in which they operate. The Consulting segment focuses on skills integration for strategy, experience, technology, and operations by domain and industry. The Infrastructure segment provides on-premises and cloud based server, and storage solutions, as well as life-cycle services for hybrid cloud infrastructure deployment. The Financing segment offers client and commercial financing, facilitates IBM clients' acquisition of hardware, software, and services. The company has a strategic partnership to various companies including hyperscalers, service providers, global system integrators, and software and hardware vendors that includes Adobe, Amazon Web services, Microsoft, Oracle, Salesforce, Samsung Electronics and SAP, and others. The company was formerly known as Computing-Tabulating-Recording Co. International Business Machines Corporation was incorporated in 1911 and is headquartered in Armonk, New York.

Software Revenue Growth – IBM’s Software segment saw a 10% rise in revenue, reflecting nearly half (45%) of total revenue
Higher Profit Margins – IBM’s GAAP gross profit margin increased to 56.3%, highlighting successful cost efficiencies and improved product mix

Low Free Cash Flow Yield – IBM’s free cash flow yield (5.78%) lagged the industry median, highlighting a comparative weakness in cash efficiency
Currency Headwind – IBM anticipates that currency fluctuations will create a modest half-point headwind to Q4 revenue growth, potentially limiting overall performance
Currency Fluctuations, Competitive Pressures in Infrastructure, Dependence on Legacy Hardware, and macro uncertainties
| Entry Price | Support* | Target 1** | Target 2** |
|---|---|---|---|
| 204.99 | 178.34 | 223.44 | 239.84 |
Data Source: REFINITIV, Analysis: StockNextt
*Support can be considered as an indicative stop-loss, and if prices move below that level on closing basis individuals may evaluate exiting the position depending on their risk appetite, previous holdings, and other factors considered. The support and resistance levels may need to be re-evaluated within 4-6 weeks’ time frame depending on the stock price movements from the date of recommendation on the stock.
**Target prices may vary by ±0.5% depending on market volatility.
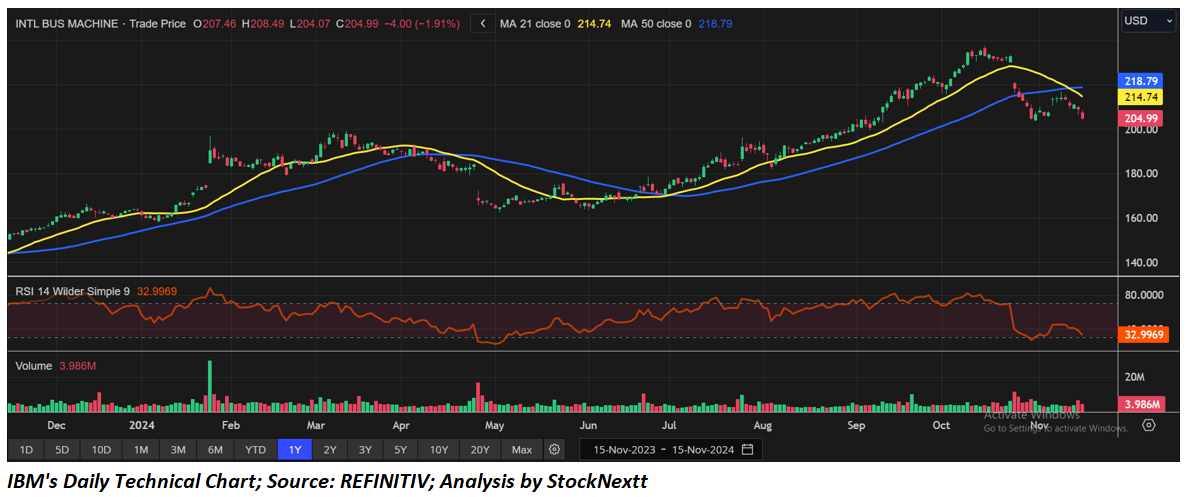
Considering the decent fundamentals, consistent top-line result, higher profitability ratios, associated risks, healthy cash balance, and current valuation, a "Buy" recommendation is given on the stock at the closing market price of USD 204.99, as of November 18, 2024.
Data Powered by EOD Historical Data (“EODHD”).
Sector: Technology Industry: Information Technology Services
| Company | Change (USD) | Price (USD) | Trailing PE (x) | Forward PE (x) | Price Sales TTM (x) | Price to Book Value (x) | Enterprise Value to Revenue (x) | Enterprise Value to EBITDA (x) |
|---|---|---|---|---|---|---|---|---|
| IBM International Business Machines |
0.33 0.16% | 213.00 | 32.79 | 20.83 | 3.32 | 8.50 | 4.06 | 20.10 |
| ACN Accenture plc |
1.16 0.81% | 144.73 | 16.00 | 14.29 | 1.66 | 3.84 | 1.65 | 9.80 |
| INFY Infosys Ltd ADR |
-0.18 1.57% | 11.31 | 25.55 | 22.78 | 4.20 | 8.01 | 4.10 | 15.87 |
| FJTSY Fujitsu Ltd ADR |
-0.03 0.15% | 20.36 | 23.27 | 14.97 | 0.01 | 3.26 | 1.74 | 11.45 |
| FJTSF Fujitsu Limited |
0.58 2.93% | 20.38 | 22.30 | 14.84 | 0.01 | 3.16 | 1.74 | 11.45 |
Data Powered by EOD Historical Data (“EODHD”).
Markets are trading in a highly volatile zone currently due to certain macro-economic issues and prevailing geopolitical tensions. Therefore, it is prudent to follow a cautious approach while investing.
Related Risks: This report may be looked at from high-risk perspective and recommendations are provided are for a short duration. Recommendations provided in this report are solely based on technical parameters, and the fundamental performance of the stocks has not been considered in the decision-making process. Other factors which could impact the stock prices include market risks, regulatory risks, interest rates risks, currency risks, social and political instability risks etc.
Note 1: Past performance is not a reliable indicator of future performance.
Note 2: The reference date for all price data, currency, technical indicators, support, and resistance levels as on November 18, 2024. The reference data in this report has been partly sourced from REFINITIV.
Note 3: Investment decisions should be made depending on an individual's appetite for upside potential, risks, holding duration, and any previous holdings. An 'Exit' from the stock can be considered if the Target Price mentioned has been achieved and is subject to the factors discussed above.
Note 4: StockNextt reports are prepared based on the stock prices captured either from REFINITIV or Trading View. Typically, REFINITIV or Trading View may reflect stock prices with a delay which could be a lag of 15-20 minutes. There can be no assurance that future results or events will be consistent with the information provided in the report. The information is subject to change without any prior notice.
Support: A level at which the stock prices tend to find support if they are falling, and a downtrend may take a pause backed by demand or buying interest. Support 1 refers to the nearby support level for the stock and if the price breaches the level, then Support 2 may act as the crucial support level for the stock.
Target: A level at which the stock prices tend to find resistance when they are rising, and an uptrend may take a pause due to profit booking or selling interest. Target 1 refers to the nearby resistance level for the stock and if the price surpasses the level, then Target 2 may act as the crucial resistance level for the stock.
Stop-loss: It is a level to protect further losses in case of unfavourable movement in the stock prices.
Disclaimer :
This report has been issued by StockNextt which has an Ontario Business Identification Number 1000958347 and British Columbia registration Number FM1051529 is a trade name under Kalkine Canada Advisory Services Inc. having Business Number 761925130BC0001. Kalkine Canada Advisory Services Inc. and StockNextt are collectively referred to as “StockNextt”, “we”, “us”, and “our”. The website https://stocknextt.com and associated pages are published by StockNextt. The information in this report and on the StockNextt website has been prepared from a wide variety of sources, which StockNextt, to the best of its knowledge and belief, considers accurate. StcokNextt has made every effort to ensure the reliability of information contained in its reports, newsletters, and websites. All information represents our views at the date of publication and may change without notice. The information in this report does not constitute an offer to sell securities or other financial products or a solicitation of an offer to buy securities or other financial products. Our reports contain general recommendations for investing in securities and other financial products. StockNextt does not offer financial advice based upon your personal financial situation or goals, and we shall not be held liable for any investment or trading losses you may incur by using the opinions expressed in our reports, publications, market updates, news alerts and corporate profiles. StockNextt does not intend to exclude any liability which it is not permitted to exclude under applicable law or regulation. StockNextt’s general advice does not in any way endorse or recommend individuals, investment products or services for your personal financial situation. You should discuss your portfolios and the risk tolerance level appropriate for your personal financial situation, with a professional authorised financial planner and adviser. You should be aware that the value of any investment and the income from it can go down as well as up and you may not get back the amount invested. Please also read our Terms and conditions for further information. Employees and/or associates of StockNextt and its related entities may hold an interest in the securities or other financial products covered in this report or on the StockNextt website. Any such employees and associates are required to comply with certain safeguards, procedures and disclosures as required by law.
Copyright © 2026 Krish Capital Pty Ltd. All rights reserved. No part of this website, or its content, may be reproduced in any form without our prior consent.